

An example of a grayscale image
Following the procedures in this activity, I opened my scanned image from activity1 and found out that it is a grayscale image. It is grayscale since the image is not in three layer of R,G and B but pixels have numbers ranging from 45 to 256. The image is shown above. Its size is 1221×967 or 1180707 bytes or 1.2MB.
Now, getting each of the basic and advanced image types:
An example of binary image

 truecolor image
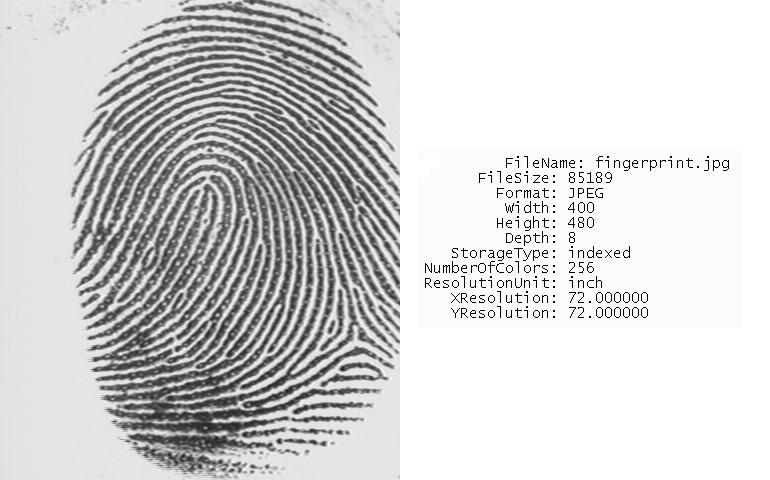
 indexed image

Choosing a truecolor image, which is the image of an elephant, and transforming it to binary and grayscale. We produce the same dimensions but only the 3 layers from RGB are removed. The dimension are both 432×550. Image is shown below.

(from left to right) binary & grayscale of a truecolor image
Now, from the graph in activity1 we extract the grayscale valuesof the image and its frequancy by getting its histogram. Once this information is known, we can binarize the image to make the points in the graph more distinct. The histogram and the choice of grayscale value to establish threshold is shown below with the resulting binary image. We note here that we first scaled the grayscale image of values from 0-255 t0 0-1 by dividing the maximum value to each pixel of the image. Then we get its histogram. The lighter colored pixels occupy most of the area in the graph. So we begin to binarize at around 0.3 value. The resulting image is shown. Although, there can be no clearer separation of the data points from the grid lines since they have common pixel values.
There is little effort done for this activity. And honestly, this activity was the most unliked one since it took me almost a semester to do it. I wasn’t able to finish the activity. I deserve a grade of 6 for this output.
